Method and Exception Flow
Some investigations need a specialized graph. Method Flow focuses on call structure, and Exception Flow focuses on how an exception unfolded.
Two focused surfaces
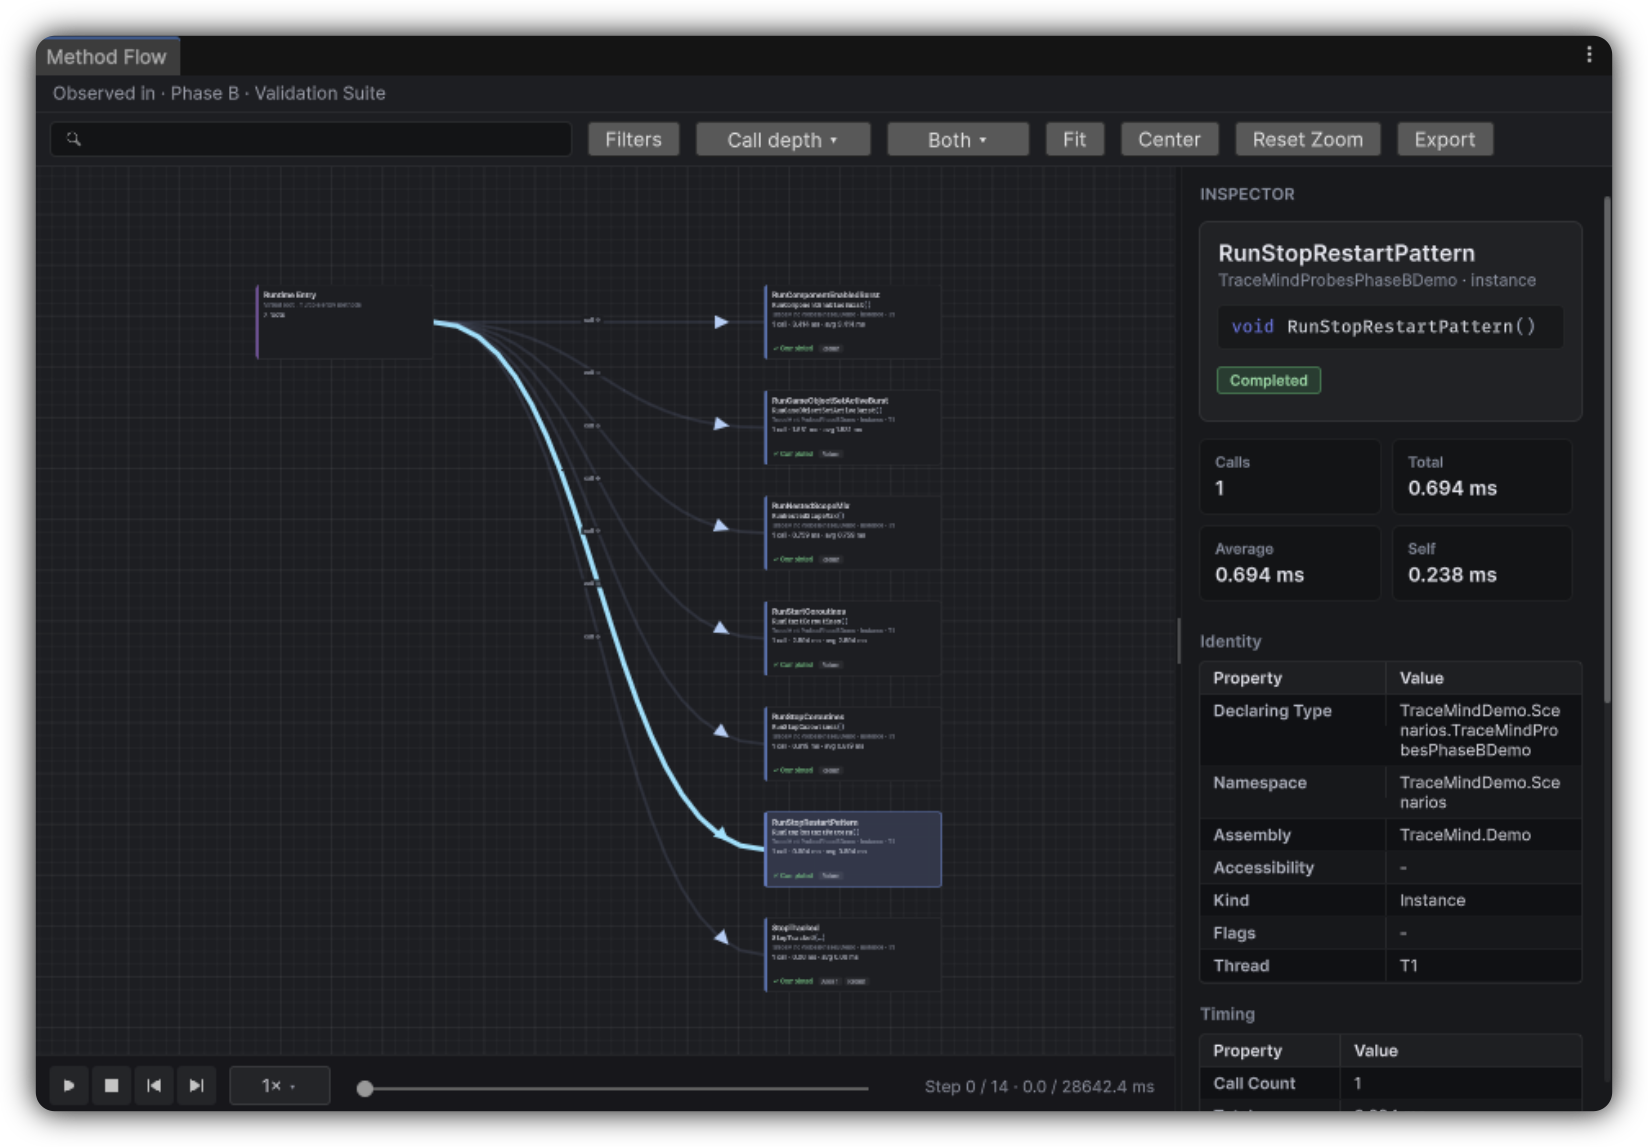
Method Flow
Method call graphs for a chosen scope. Use it to understand which methods participated around a moment, how call structure clusters by class, and whether an unexpected method entered the path.
Exception Flow
The dedicated surface for exception-centric analysis. Use it when an exception is the symptom and you need the surrounding call and scope story, not only a stack dump.
Choosing between them
| Question | Open |
|---|---|
| How did methods call each other here? | Method Flow |
| How did this exception unfold? | Exception Flow |
| Why did this watched property write happen? | Causal Flow |
Method Flow tips
Start from a relevant scope
Enter from Tree or a related drill-down where the story lives.
Reduce clutter
Use class layout preferences to organize dense graphs.
Export when useful
Export a graph image when a visual artifact helps a ticket or review.
Tame extreme density
Review high-frequency capture Preferences and Scenario Tracking if the graph is overwhelming.
Exception Flow in practice
Exception Flow helps teams move from "it threw" to "this is the path that led here." Use it when you need to place an exception into the larger recording narrative rather than reading a stack trace in isolation.
Playback and navigation
- Previous exception / Next exception: move between throws in the recording
- Play / Pause path toward exception: walk the reconstructed failure path
- Inspection pane: details for the selected graph node
When the chain is incomplete
Exception Flow displays limitation notes when reconstruction cannot be fully confident, for example:
- Call chain reconstructed from exception origin only
- Event graph unavailable, showing origin method only
- No tracked method was linked to this exception
- A caller was not found in recorded executions
Widen Tracking, add Watches on state leading into the throw, re-record, and open Exception Flow again.
Runtime Story
Runtime Story (Runtime Flow view) builds a contextual narrative around a focused Watch, Probe, Method, or Exception, showing related and nearby activity on a story spine. Use it when you need surrounding context before diving into a specialized graph.
Quality levers
Specialized graphs inherit Scenario quality.
Tight Tracking
Improves Method Flow readability by keeping irrelevant methods out.
Enabled Watches
Unlock stronger value-focused stories alongside the call graph.
Profile depth
Controls how much detail is available in the graph.
If a graph is noisy, improve the Scenario and record a cleaner take.