Tree, Flow, and Timeline
Three lenses answer different questions about the same recording. Learn when to use each, and your investigations get faster immediately.
The three lenses
Tree
Presents hierarchical scopes and events. Start here when you know roughly where the story lives, or when you need hierarchical context before time-based exploration.
Flow
Also called Scope Flow, it visualizes execution travel through the scope hierarchy. Use it when the question is about path rather than hierarchy: did execution enter the expected scope, did it take an unexpected branch, and where did it diverge from your mental model?
Timeline
The time-centric investigation board, with profiler-style modules. Use it when the question is when the value flipped, what spiked before the failure, or whether a probe event preceded a watched write.
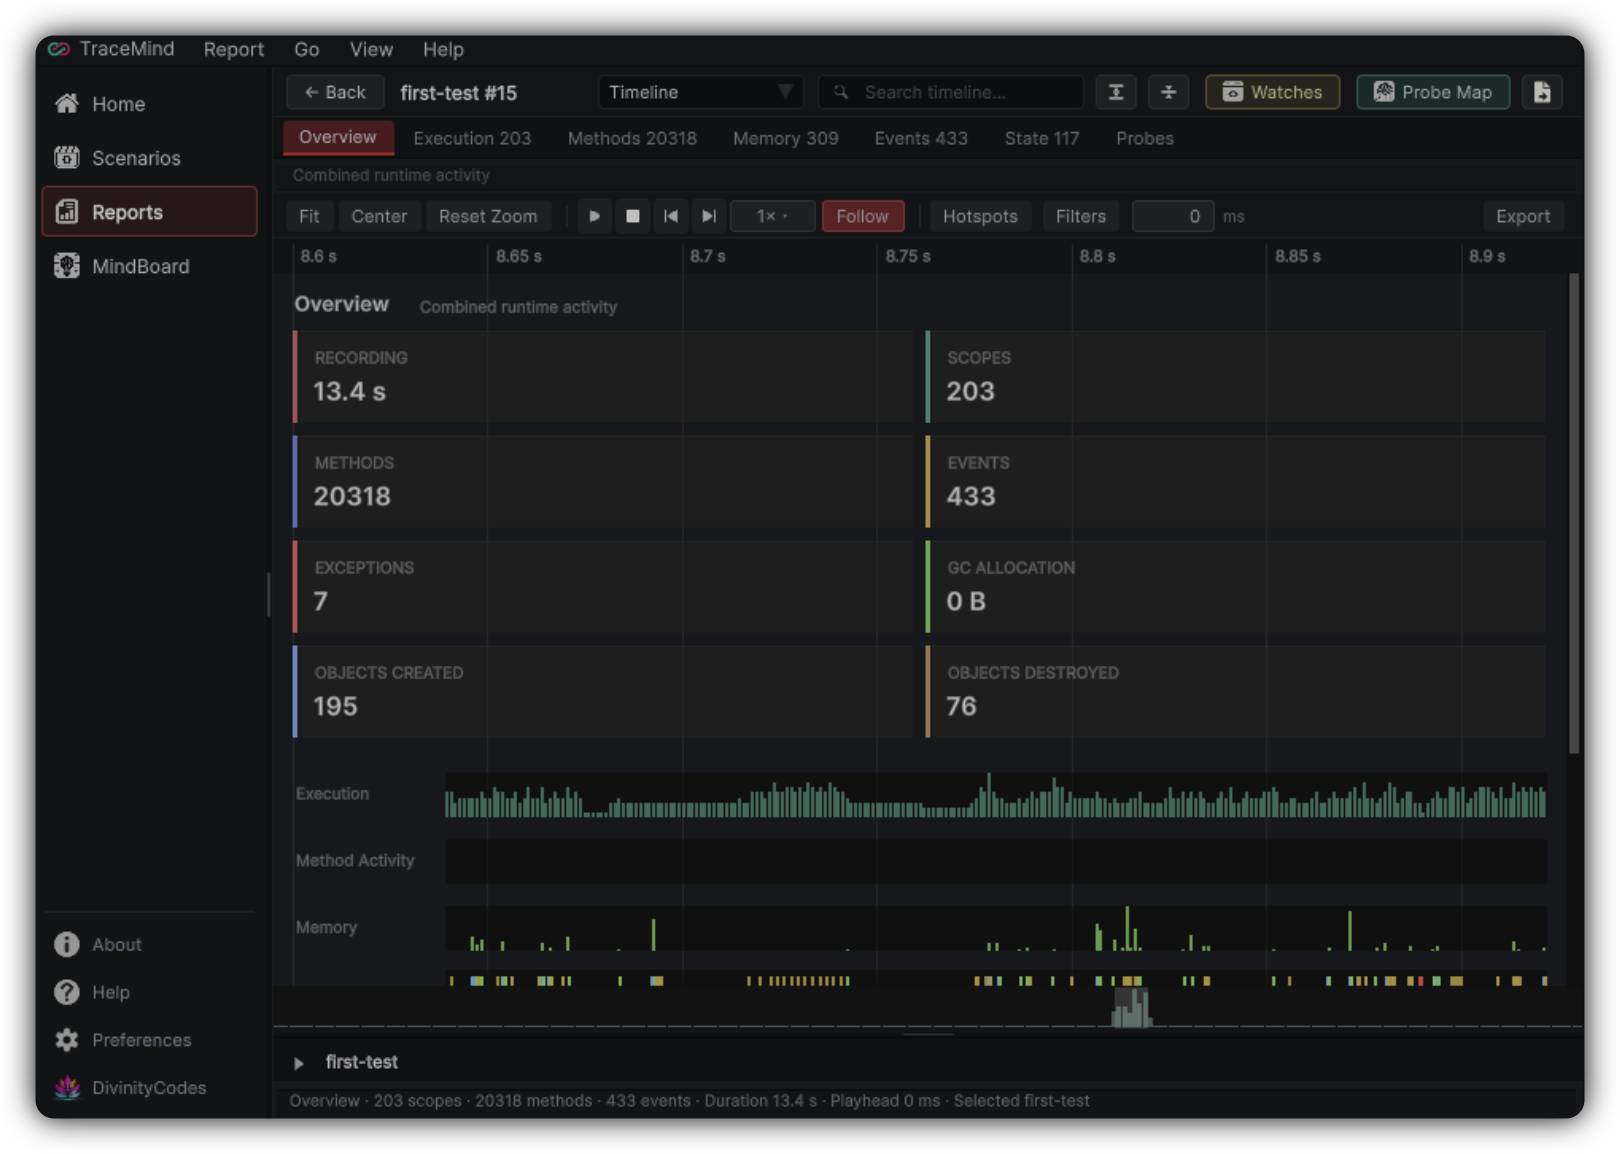
Timeline modules
| Module | What it shows |
|---|---|
| Overview | Combined runtime activity |
| Execution | Scope hierarchy and runtime duration |
| Methods | Method invocations and call activity |
| Memory | Object lifetime and GC activity |
| Events | Runtime events and exceptions |
| State | Recorded state transitions |
| Watches | How watched values evolved and what caused changes |
| Probes | Environment probe activity |
Choosing the right lens
| If you ask | Open |
|---|---|
| Where in the hierarchy? | Tree |
| How did execution travel? | Flow |
| When did it happen? | Timeline |
| What did a value do over time? | Watch Studio |
| What did the environment do? | Probe Map |
A practical reading pattern
- Timeline Overview
- Tree around the spike
- Flow for path confirmation
- Specialized surface
Timeline Overview
Start with time. Skim the Overview module to find the range where the recording gets interesting, such as a spike, a gap, or an exception marker.