Watches
A Watch pins a member so TraceMind can record how its value changes over time and, critically, why each write happened through Causal Flow.
Watches are not Tracking
Tracking instruments method execution. Watches observe member values. For state bugs, configure both: Tracking supplies the call story; Watches supply the value story.
What a Watch gives you
Value history
Old and new values at each change, laid out over the recording in Watch Studio.
Causal chains
Walk from a suspicious write back through calls and boundaries to the entry that started it.
Timeline alignment
Watch lanes on the Report Timeline show when values moved relative to execution and probes.
MindBoard evidence
Reference a Watch or a specific Watch change on your investigation canvas.
Creating a Watch
From the Tracking Editor
The fastest path: open a Scenario, launch Open Tracking Editor, find the type and member, then add a Watch from the member inspector.
From the Add Watch window
The dedicated wizard uses six sections:
| Section | Purpose |
|---|---|
| SOURCE | Where the Watch is created from (Scenario context) |
| TARGET | Assembly, declaring type, and member |
| OBSERVE | What to observe (Value Changes in V1) |
| CAPTURE | Previous/new value, context, caller, frame flags |
| OBSERVATION | Direct vs Deep observation depth |
| IMPACT | Cost band and strategy preview |
Instance scope
| Scope | Use when |
|---|---|
| This Instance | You care about one object instance (typical for scene objects) |
| This Type | You care about any instance of the type |
TraceMind V1 does not offer an "All Instances" scope, so keep Watches focused.
Observation depth
| Depth | Behavior |
|---|---|
| Direct | Default; captures the member value directly |
| Deep | Opt-in for reference types; can surface nested members (subject to Preferences limits) |
Observation strategies
Depending on the member, TraceMind may use:
- Harmony Accessor: property setter/getter instrumentation
- Explicit API: when you call TraceMind APIs directly
- Unsupported: member cannot be observed (common for some fields in V1)
Watch status labels include Watching, Waiting, Unsupported, Target lost, Error, and Paused.
Recording Watch data
Watches belong to a Scenario. When you Start Recording, enabled Watches begin observing during Play Mode. Each confirmed change is stored in the Report with timing, old/new summaries, and optional causal stack data.
Fields vs properties
Property Watches are the primary supported path. Field observation may show Unsupported depending on member and strategy. Prefer watching the property that owns the symptom.
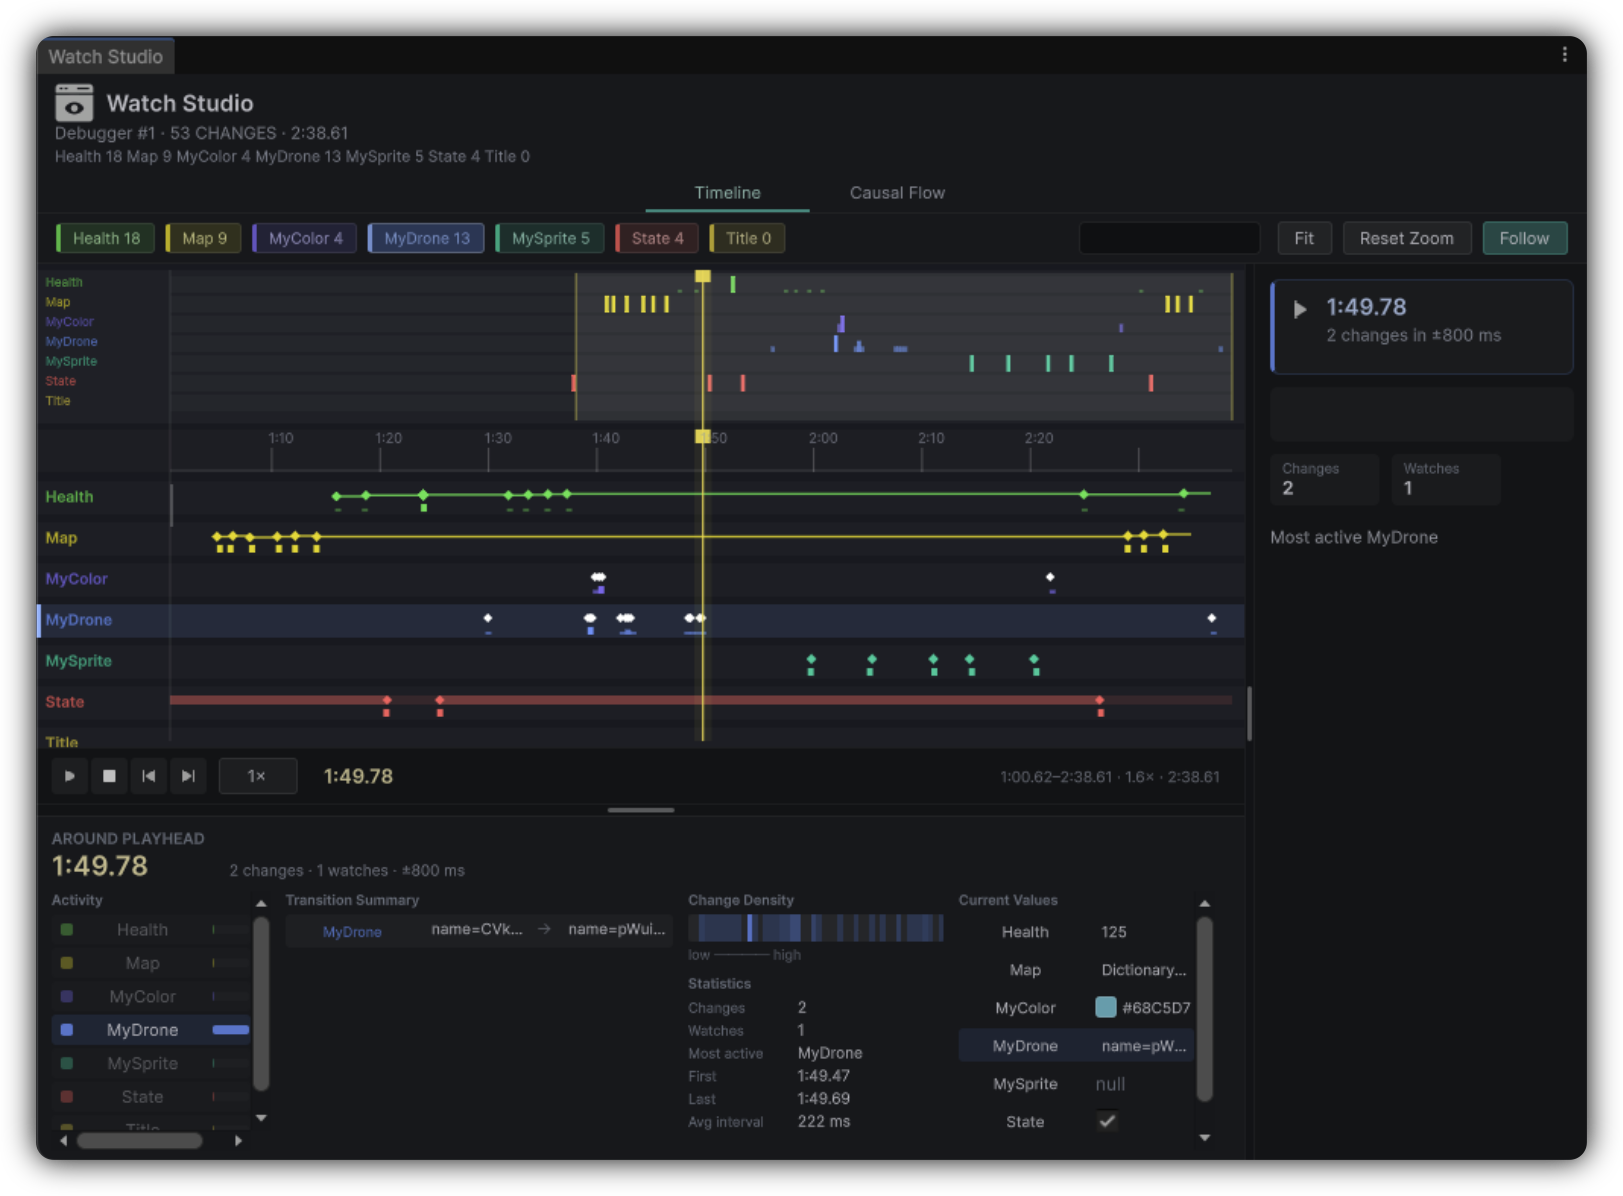
Watch Studio
Open Watch Studio from a Report toolbar or the Go menu when a Report is active.
| Tab | Purpose |
|---|---|
| Timeline | Lanes per watch, playback, filters, analysis and inspector panes |
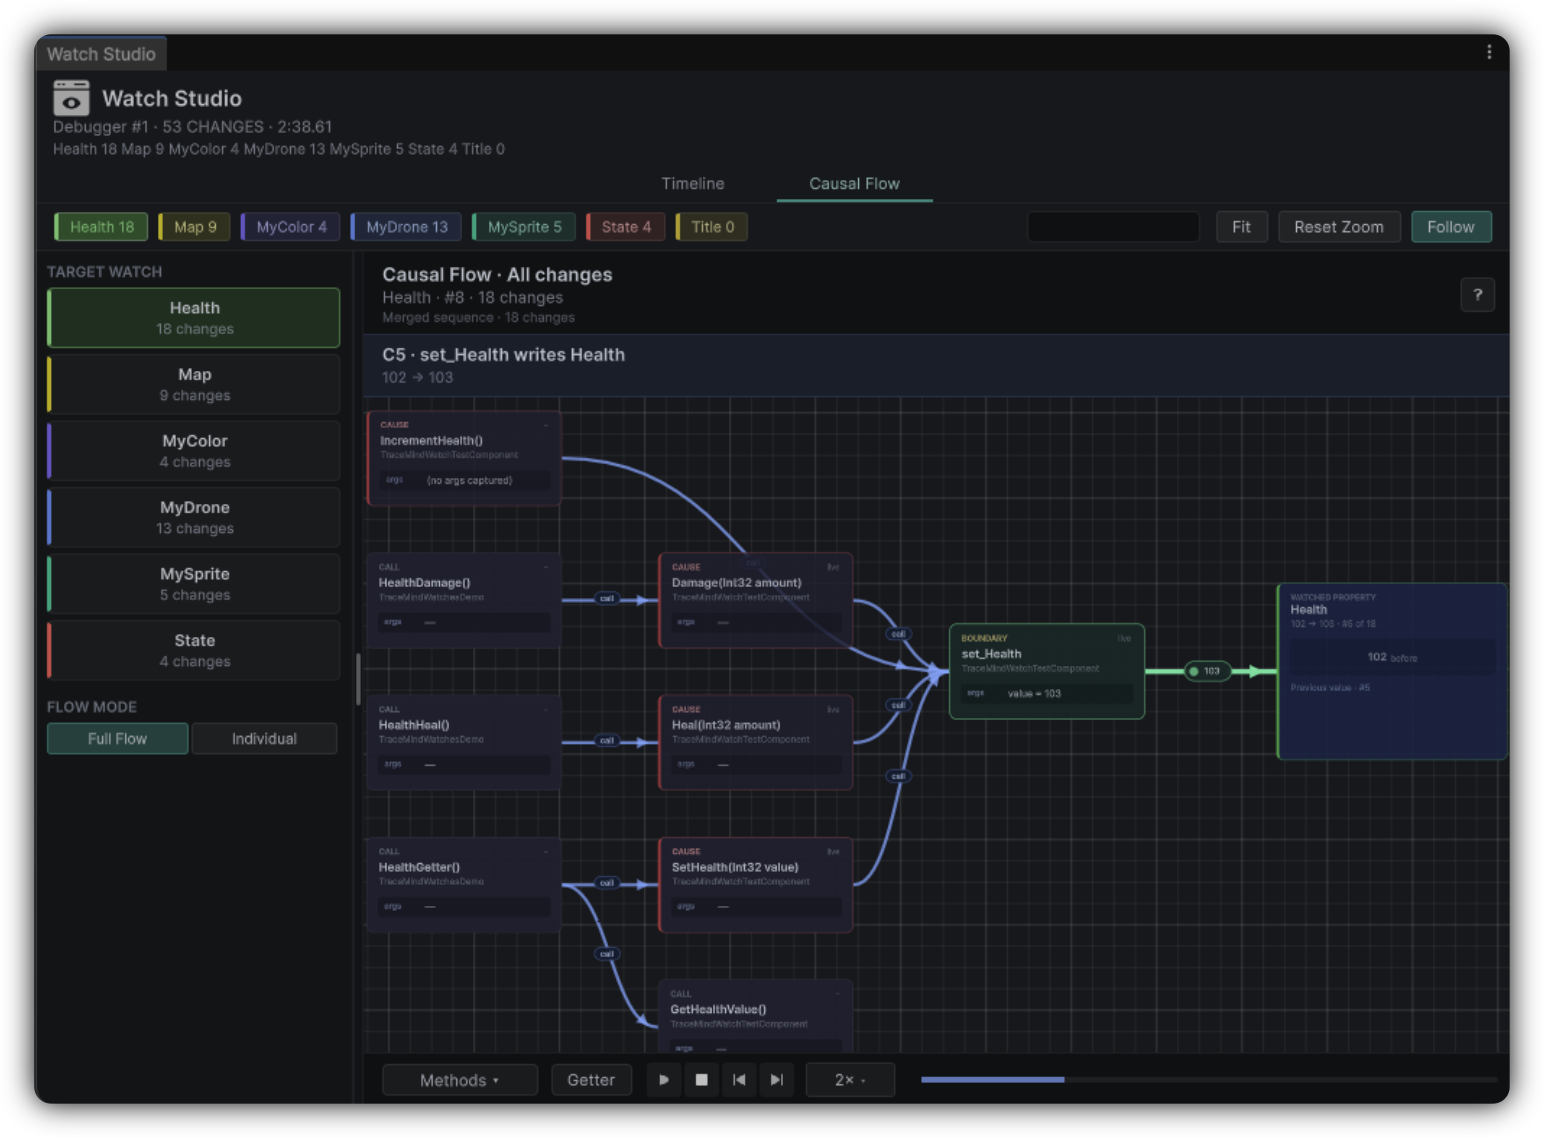
| Causal Flow | Graph of how methods led to property writes |
Toolbar controls include Fit, Reset Zoom, Follow, and search ("Filter Watches and values…").
Causal Flow modes
| Mode | When to use |
|---|---|
| Full Flow | See causal paths for every recorded change on the selected watch |
| Individual | Focus on one specific change: pick it from the CHANGE selector |
The picker also exposes TARGET WATCH and FLOW MODE.
Navigating from a Watch to source
From Watch Studio or Report drill-downs you can:
- Open Method Flow from a causal chain node
- Jump to Tree or Timeline at the change time
- Add to MindBoard as a Watch or WatchChange reference
- Use Open on a reference node to return to the live source when still available
Managing Watches
From the Scenario workspace Watches panel you can enable, disable, or remove Watches without deleting the Scenario. Disabled Watches do not record on the next take.