Investigating runtime object behavior
When the bug involves scene flow, spawn/destroy order, coroutines, animator transitions, or resource loading, you need the environment timeline beside your code, not method traces alone.
When to use this workflow
- Objects disappear before a callback runs
- State changes right after a scene load or unload
- Coroutines overlap or never complete
- Animator transitions precede gameplay glitches
- Async resource loads correlate with hitches or wrong state
Overview
Step 1: Scope the Scenario
Create or open a Scenario named after the behavior (for example Boss Intro Sequence).
Use Standard Profile unless the reproduction is extremely heavy.
Step 2: Enable the right Probe categories
On the Scenario Probes panel, enable only what the bug can touch:
| Symptom hint | Enable |
|---|---|
| Wrong scene active | Scene |
| Missing or duplicate object | Instantiate, Destroy |
| Enable/disable races | Component |
| IEnumerator timing | Coroutine |
| Animation-driven state | Animator |
| Reparenting / added components | Hierarchy |
| Resources / bundles / Addressables | Resource, Addressables |
Do not enable Physics expecting data: it is not supported for capture in the current release.
Step 3: Track code that owns the behavior
Open the Tracking Editor and track:
- The type that applies the gameplay state change
- Any coordinator (scene loader, spawner, state machine) you suspect
Add a Watch on the value that proves the bug (health, phase flag, etc.) even when probes are the main lens. The Watch gives you a precise time anchor.
Step 4: Record with deliberate reproduction
- Start Recording.
- Perform the minimum steps to trigger the bug (one clean path).
- Stop Recording as soon as the symptom appears.
Keep the take short. Long recordings make lane correlation harder.
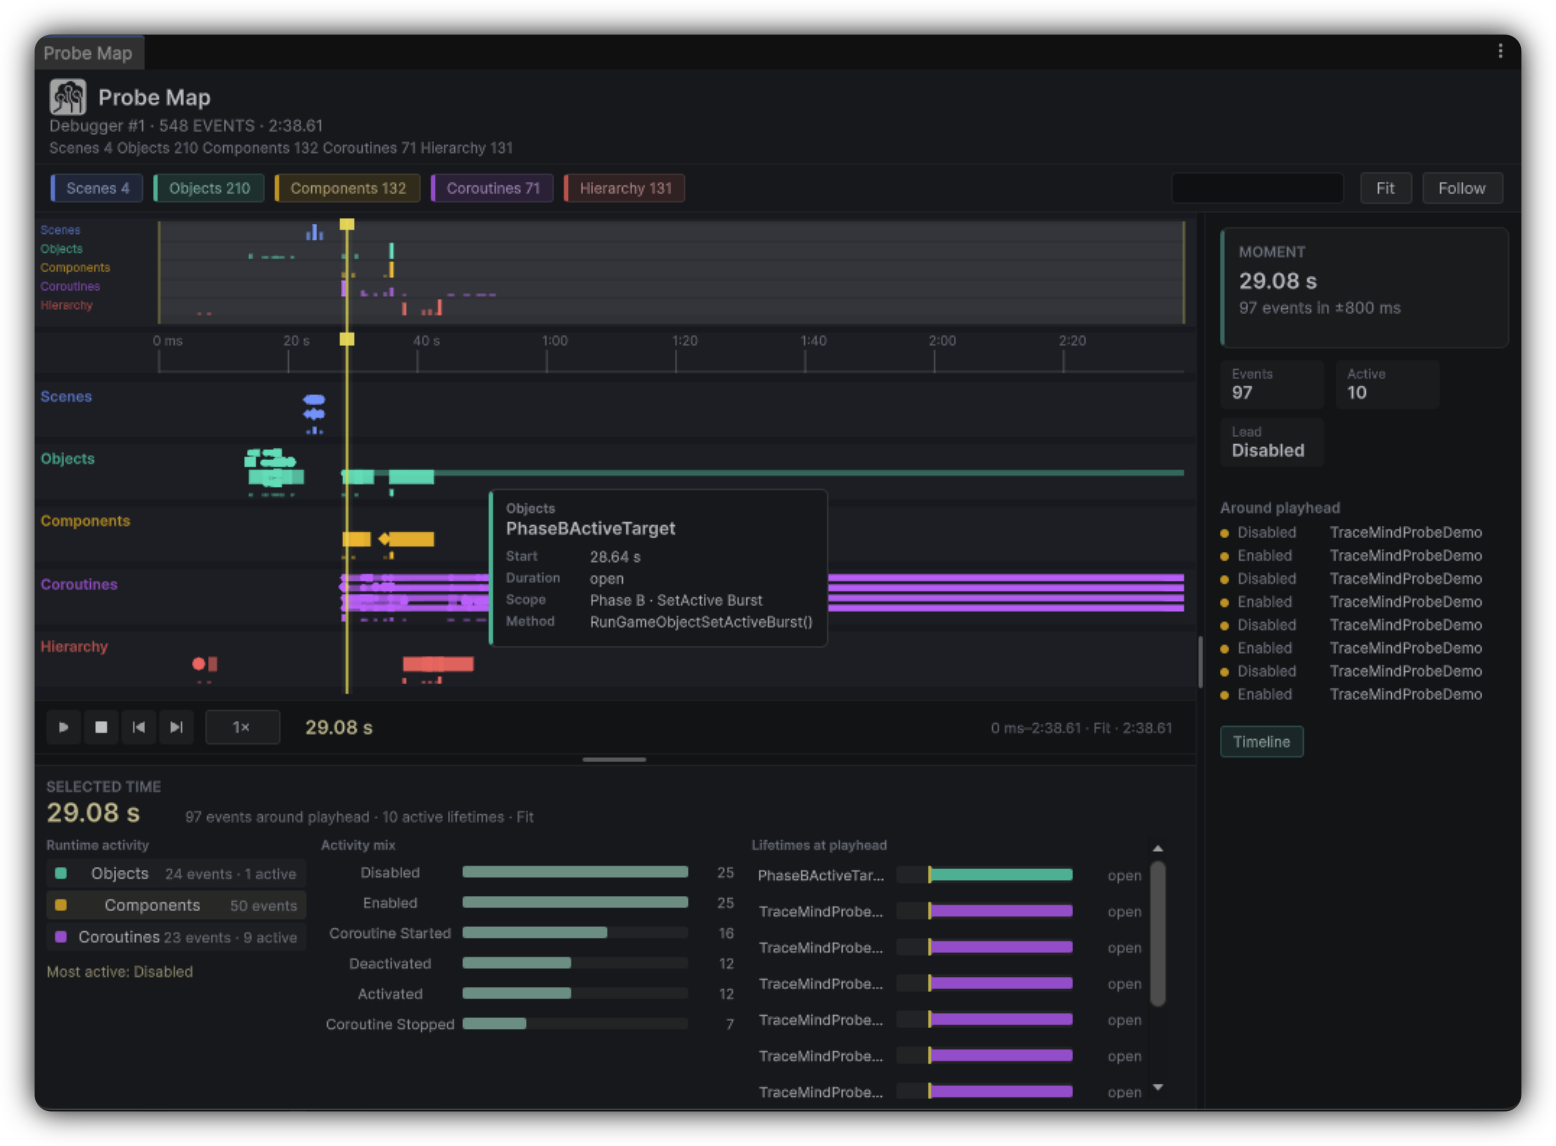
Step 5: Open Probe Map
From the Report toolbar, click Probe Map.
- Scrub playback to the symptom window.
- Filter lanes to the categories you enabled.
- Search for object names, scene names, or coroutine labels if needed.
- Select events in the inspector pane for detail.
Step 6: Correlate on the Timeline
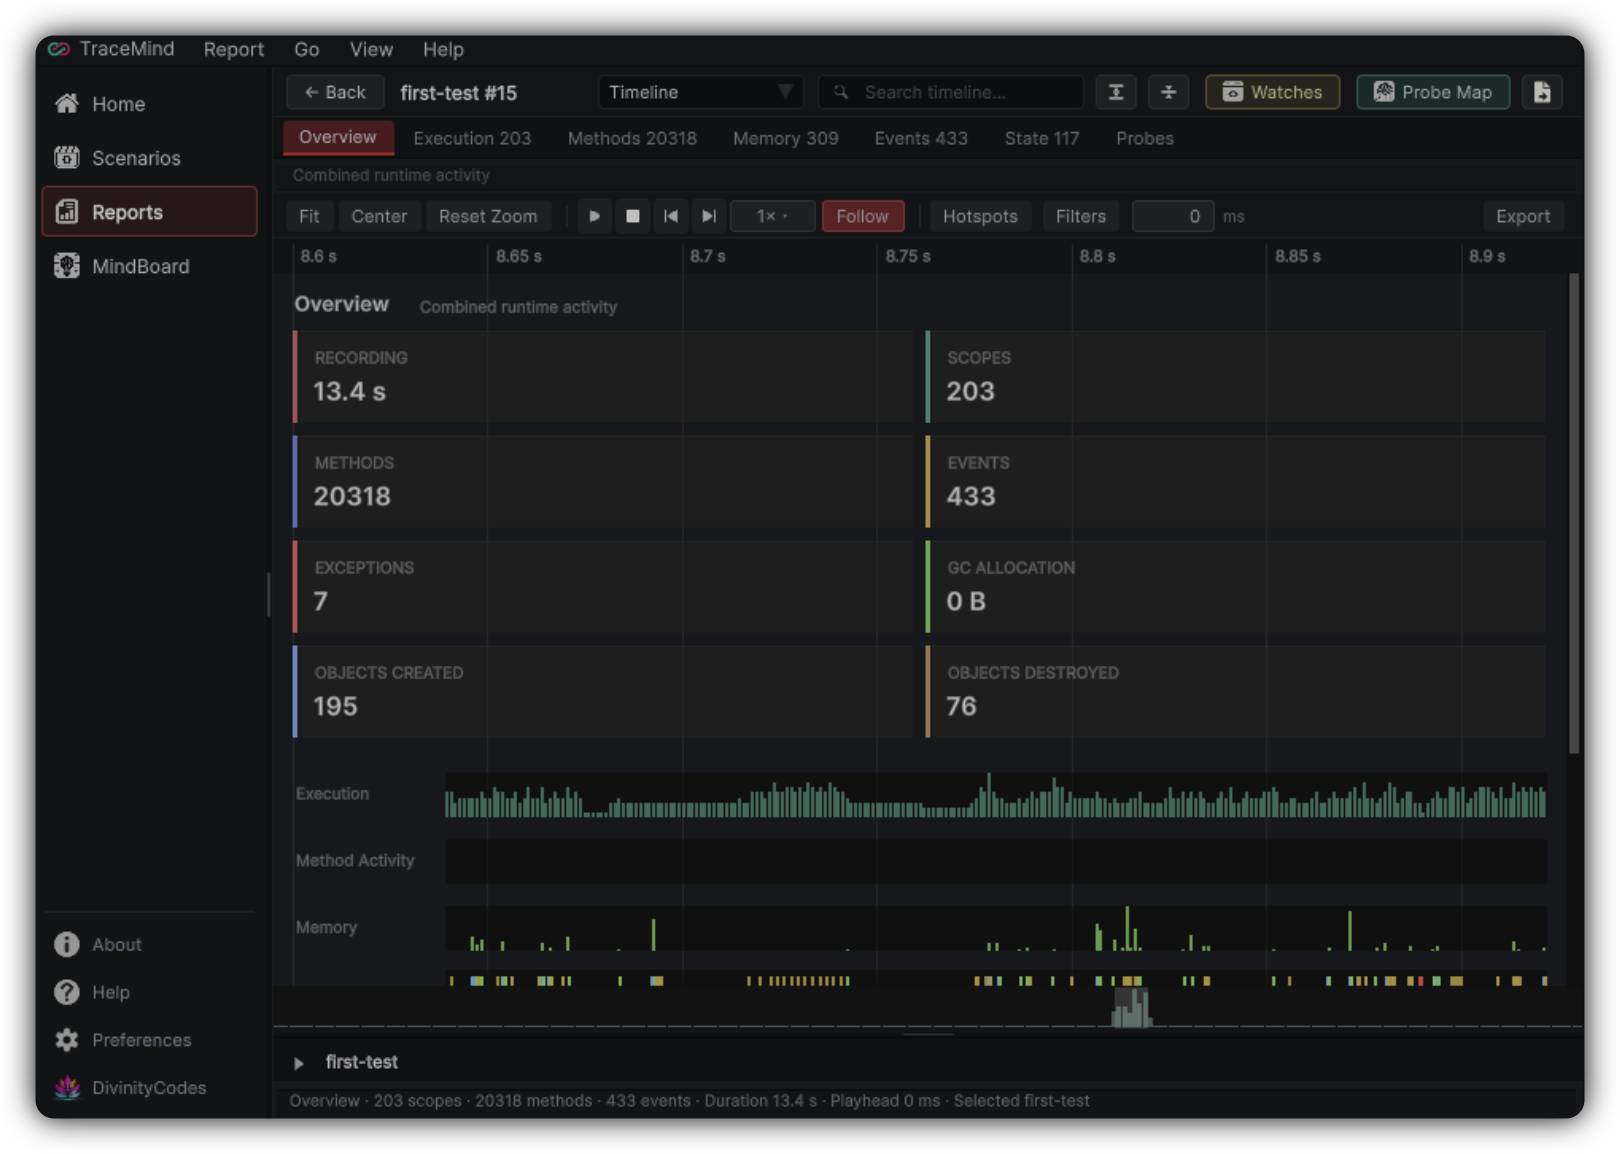
Open the Report Timeline view:
- Start with Overview to find spikes or gaps.
- Open Probes and Watches modules together.
- Align the playhead so probe events and watch changes share one moment.
Ask: did the environment event happen before, with, or after the bad state?
Step 7: Drill into code when needed
When a probe event implicates specific logic:
- Open Tree at that time for scope context
- Open Flow to see execution travel through scopes
- Open Watch Studio if a value flip is the proof point
Step 8: Document on MindBoard
- Add Probe or ProbeObservation references for the decisive events.
- Add a Note describing the ordering you proved ("Destroy fired before OnDisable callback completed").
- Link with Triggered or Caused By as appropriate.
Example reading pattern
Timeline Overview  →  find symptom time
Probe Map          →  see which lane fired
Tree               →  find scope that owned the code
Watch Studio       →  confirm value transition
MindBoard          →  state the ordering conclusion