Investigating a suspicious value change
When a field or property flips unexpectedly, TraceMind lets you see when it changed and walk why the write happened, without scattering temporary logs through your codebase.
When to use this workflow
- Health, ammo, score, or flags change without an obvious cause
- Two systems appear to write the same state
- A value is correct in the Inspector once, wrong on the next frame
- You need to explain a write to a teammate or reviewer
Overview
Step 1: Create or open a Scenario
From Home or Scenarios, create a Scenario named after the system (for example Player Health Sync).
Choose Standard Profile for a first pass unless you already know the capture must be minimal or deep.
Step 2: Track the owning code
Open Open Tracking Editor from the Scenario.
- Search for the type that owns the suspicious member.
- Track Type (or a narrower member set if the type is huge).
- If the writer may live in another system, track that caller type too.
Do not skip Tracking
Causal Flow needs instrumented methods along the path. A Watch alone does not record call activity.
Step 3: Add a Watch on the symptom member
From the Tracking Editor member inspector, or Add Watch:
- Select the property (preferred) or field if supported.
- Set This Instance when debugging a specific scene object.
- Confirm status is Watching, not Unsupported.
Step 4: Enable Probes only if timing matters
If the bug might involve scene load, destroy order, coroutines, or animator state, enable the matching Probe categories. Skip probes when the bug is purely logical inside one type.
Step 5: Record a clean reproduction
- Start Recording (Scenario locks editing while recording).
- Enter Play Mode if not already there (auto-enter Play Mode is a Preference).
- Reproduce once, from a known start state to the bad value.
- Stop Recording immediately after the symptom.
The new Report appears under the Scenario and in Reports.
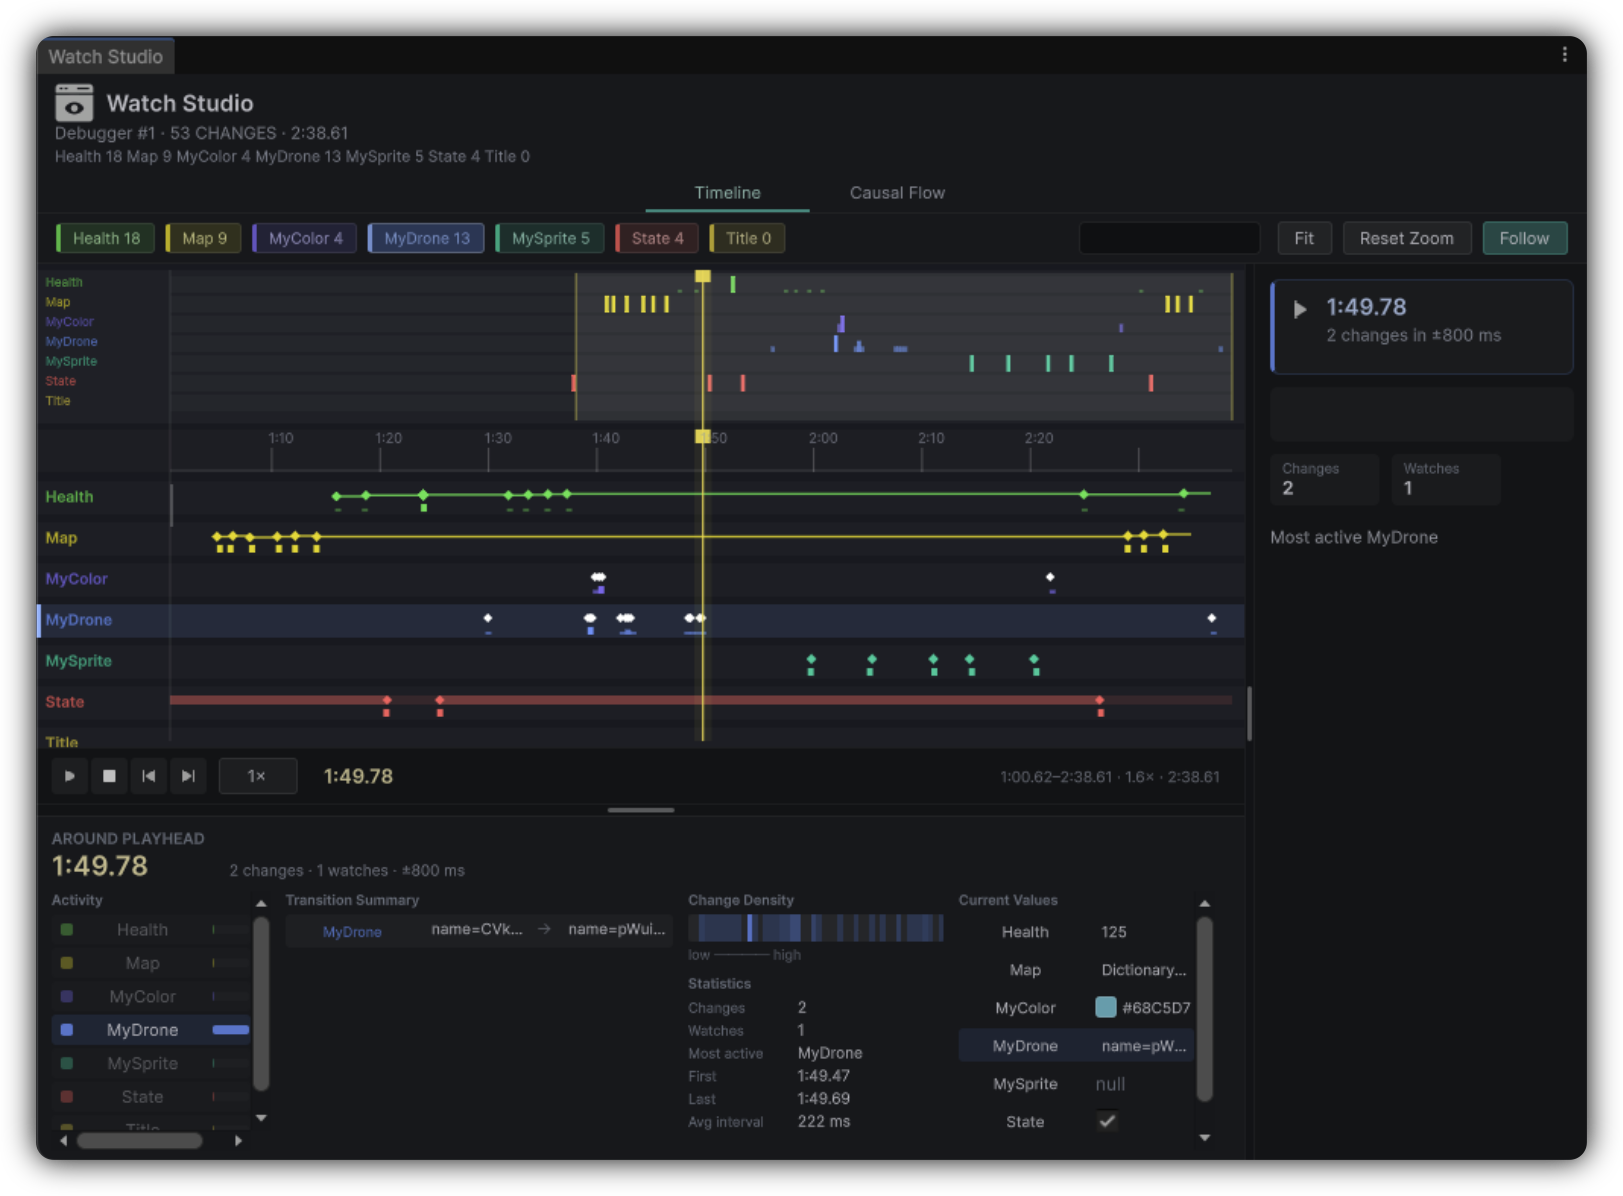
Step 6: Find the change in Watch Studio
- Open the Report.
- Click Watches in the toolbar (or Go → Watch Studio).
- On the Timeline tab, locate the lane for your Watch.
- Step through changes with Previous change / Next change or playback.
Note the old → new summary and the time of the decisive transition.
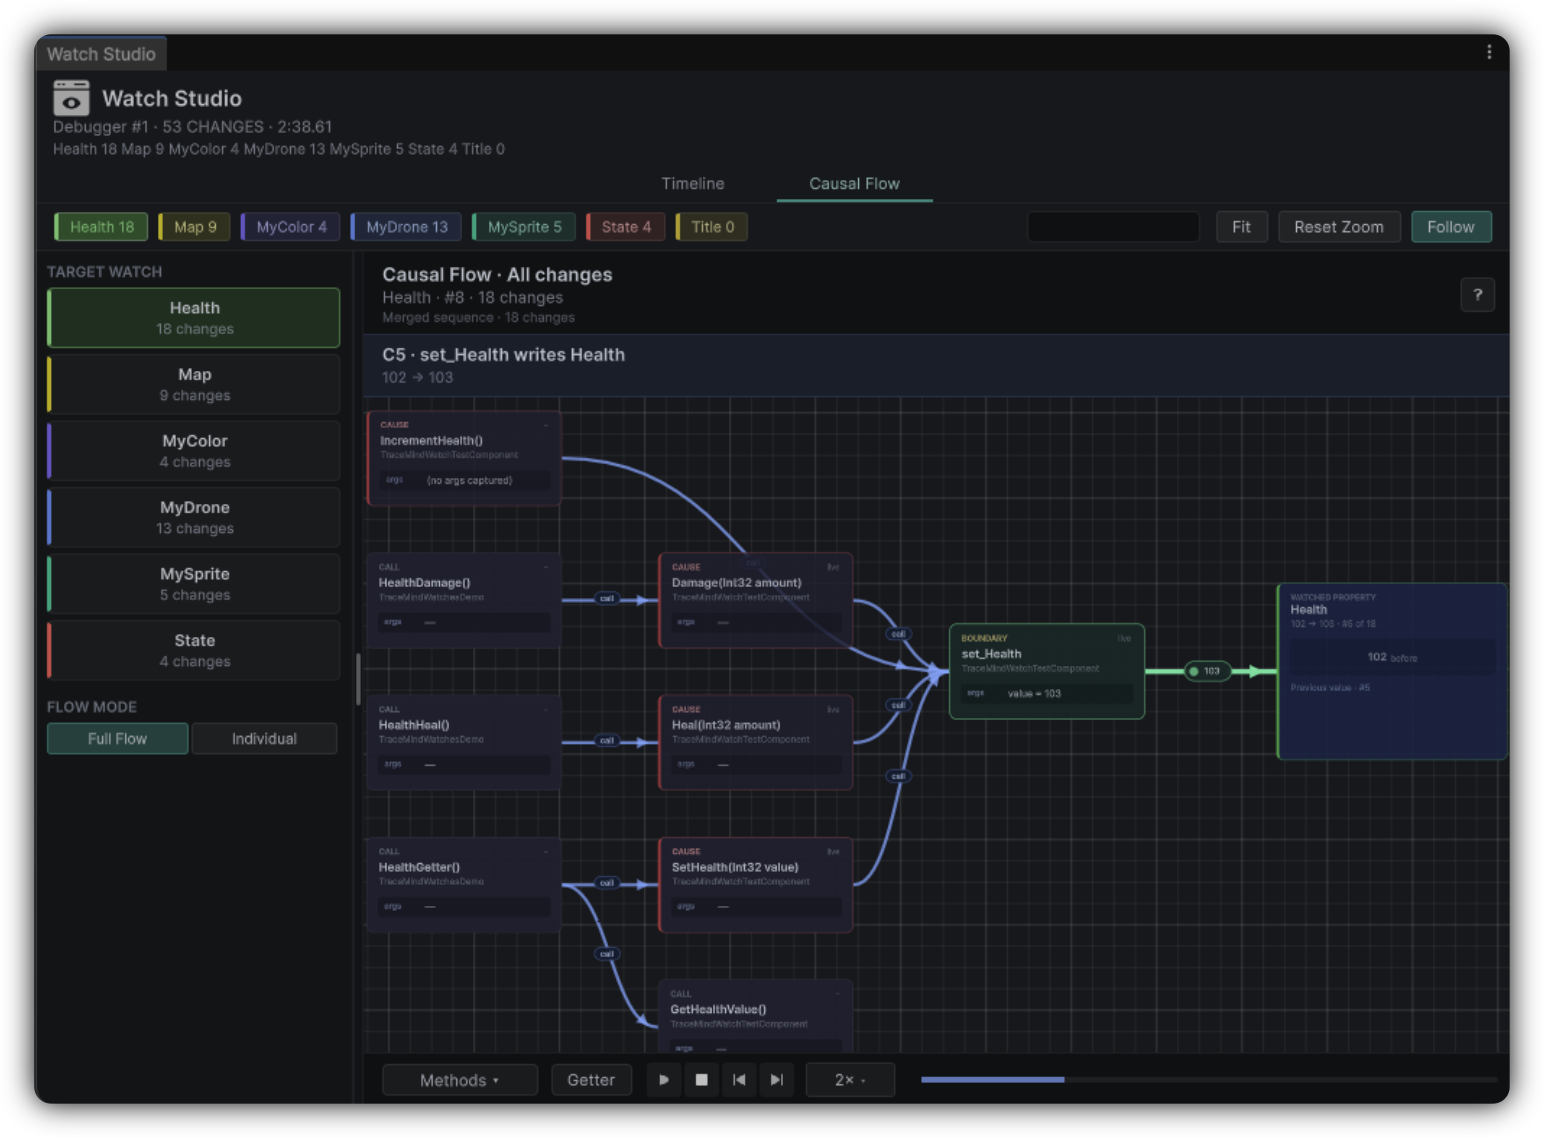
Step 7: Open Causal Flow
- Switch to the Causal Flow tab in Watch Studio.
- Select TARGET WATCH.
- Choose Individual mode and pick the suspicious CHANGE (or Full Flow to compare all writes).
- Walk the graph from Entry toward the Watched property.
Pause on unexpected Cause or Getter nodes: that is usually where the bug hides.
Step 8: Drill into execution
From a causal node or Tree context:
- Open Method Flow for call structure in a scope
- Open Tree at the change time for hierarchical context
- Open Timeline Watches module to see surrounding activity
Step 9: Capture the conclusion on MindBoard
- Add to MindBoard on the Watch change or Report.
- Add a Note: plain-language hypothesis ("Respawn handler wrote health to 0 after cancel").
- Connect Reference → Note with Caused By or Supports.
If the chain is incomplete
| Symptom | Next move |
|---|---|
| Missing caller in Causal Flow | Track the suspected caller type; re-record |
| No changes in Watch Studio | Confirm Watch enabled; confirm write happened during recording |
| Shallow values | Raise Profile or adjust Watch depth in Preferences |
| Too much noise | Narrow Tracking; shorten the take |